Devpost
Participate in our public hackathons
Devpost for Teams
Access your company's private hackathons
Grow your developer ecosystem and promote your platform
Drive innovation, collaboration, and retention within your organization
By use case
Blog
Insights into hackathon planning and participation
Customer stories
Inspiration from peers and other industry leaders
Planning guides
Best practices for planning online and in-person hackathons
Webinars & events
Upcoming events and on-demand recordings
Help desk
Common questions and support documentation
A graphic dashboard for visualizing the flow of Twitter information from Chinese entity owners to their parents, broken down by trade region.
We analyzed and visualized different aspects of the China's state social media. Also, we did data scraping using Python to extract more information about accounts on different platforms.
A captivating journey through data discovery. From meticulous analysis to compelling visuals, our team unveils the stories within the Canis Dataset. Join us in exploring that!
We are visualizing the impact of Chinese accounts in different social media platforms on the rest of the world with a focus on recent events in the Israel-Palestine conflict.
2023 CANIS Hackathon: Data Visualization and Foreign Interference
I used Tableau (for the very first time!) to extract meaningful information from the data regarding the Chinese social media .
Feature
A 3D, fully interactive, data-visualization simulation to show you the impact of Chinese Foreign Interference.
Analysis of the influence of Chinese media on the world
Explore social media landscapes with Visual Explorer: An interactive platform revealing regional user insights through dynamic maps and data analytics.
In this project, we investigate Chinese state media's Twitter presence in an effort to compare its influence in Western and non-Western countries.
This Project visualizes the Chinese government's influence on social media, revealing patterns and dynamics in digital discourse, fostering discussions on information control in the online sphere.
This project seeks to provide evidence for whether the Chinese are seeking to influence Canadian (Western) politics by analysing the social media activity of the Chinese institutions in the dataset.
Offers a visually striking and insightful exploration of China's digital presence across media entities, their social media platforms, and online influence.
Canis Pro: Illuminating Global Engagement - Transforming Diverse Social Media Data into Insightful Visual Narratives.
Unveiling the Digital Reach of Chinese Media: Insightful Analytics Powered by React.js and Python Visualization.
Insights Illuminated: Navigating Data Horizons through Visual Excellence
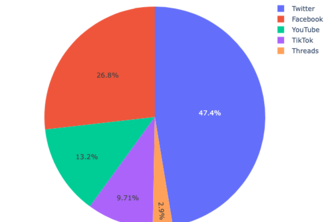
A comprehensive analysis of chinese state agents presence and network across twitter, facebook, and youtube.
Focus on finding relation between language, entity, region and social media stats.
Showing the scale of China’s influence on social media.
In this project, we aim to focus on creating visualizations that elaborate on the scale of the foreign intervention from the Chinese government toward English-speaking countries.
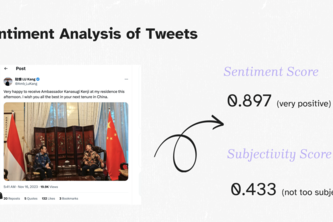
A Data-Driven Dashboard for Foreign Interference—Where, When, Who, Why, How, and How Much Analyzed through Web Scraping, NER, Sentiment Analysis, and Graph Insights.
Data Visualization using python
1 – 24 of 47